

Car Accident Statistics in NYC
Click For Your Free Consultation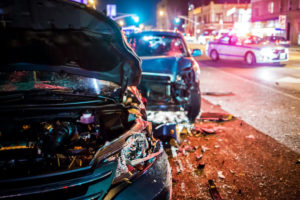
New York City is the most populated city in the United States – and it’s got the traffic to prove it. According to U.S. News and World Report, NYC ranks 4th for the worst traffic in the nation. Not surprisingly, heavily congested roads in a densely populated area result in a lot of traffic accidents.
Our team did an in-depth analysis of NYPD crash data – here’s what you need to know about car accidents in NYC.
Table of Contents
It depends on the year. In 2019, there were a total of 134,224 car accidents in New York City. In 2020, the year of a raging pandemic, reported collisions declined by roughly 50%, for a total of 88,323. In 2021, a year still largely influenced by COVID, accidents increased to a total of 97,059. As of early March 2024, statistics for 2023 are still preliminary. In 2022, there were 100,508 accidents in NYC.
So, despite the fact that NYC came to a near-halt in 2020, there was still an average of 303 car accidents on the city’s streets every single day that year. And things have only gotten worse since then – at least based on the most recent full data available.
In 2022, Brooklyn had the largest share of NYC’s traffic accidents.
However, that’s not always the case. In 2018 and 2019, Queens actually had the largest percentage of NYC car accidents. Brooklyn did have the largest in 2020 as well.

Typically, one out of every two-to-three accidents in NYC causes an injury. Unfortunately, the trend is alarming. Roughly speaking, around half of collisions resulted in injury in 2018 and 2019, respectively.
However, while the total number of car crashes in NYC declined in 2020 and 2021 relative to the previous two-year period, the percentage of those resulting in minor injuries and catastrophic injuries increased. In 2020 and 2021, more than half of the car accidents in the city resulted in an injury.
Brooklyn not only has the most traffic accidents of any NYC borough in 2021; it also had the highest percentage of injury-causing collisions.
If you’re involved in a car accident in NYC, there’s around a 60% chance you got into an accident in Brooklyn or Queens. Those two boroughs, together, account for 62.1% of all crash-related injuries in the city.
Every year, hundreds of people are killed in car accidents in New York City:
The years 2020 and 2021 saw a slight surge in the share of fatal crashes, despite a drop in the total number of collisions.
Brooklyn had the largest share of fatal crashes in NYC in 2021.
This reflects a departure from the statistics from prior years to some extent. In 2018, 2019, and 2020, Queens also had the highest percentage of motorist fatalities.
There are accidents every day throughout New York City. However, crash data reveals that some months see more collisions than others, but not by a significant margin.
For example, in 2021, Brooklyn had the most crashes in the month of September with 2,850. Manhattan had the most accidents in October that year with 1,482. The summer and early fall months tend to have the most crashes across all of the boroughs, and that remains true throughout the past few years.
Statistically speaking, the winter months appear to have the fewest collisions in NYC. For instance, in 2021 Manhattan saw 766 car crashes and Brooklyn has 1,896. For each of the boroughs in NYC that year, February was the month with the least crashes. The year 2020 was somewhat of an anomaly, however, because the height of the pandemic was during the months of April and May. Those months in that year saw relatively few crashes in particular.
Despite increased traffic safety measures, bicyclists are involved in many traffic accidents across the five boroughs. In 2021, there were a total of 5,568 bike accidents in NYC.
Those resulted in:
Brooklyn saw the most bicycle accidents with 2,151 (38.6%). Manhattan had the second most (1,410 or 25.3%), followed by Queens with 1,142 collisions (20.5%), the Bronx (774 or 13.9%), and Staten Island (91 or 1.6%).
In 2021, 8.9% of all motor vehicle accidents in the city involved a pedestrian.
That year, there were a total of 8,693 pedestrian accidents. 7,205 caused an injury, while the remaining 125 were fatal.
Brooklyn is the most dangerous borough for pedestrians, while Staten Island is the safest:
Statistically speaking, about 3 out of every 5 pedestrian accidents take place in Brooklyn or Queens.
During a typical year, roughly 1,500 motorcyclists are involved in traffic accidents in the city. In 2021, there were 1,723 motorcycle accidents in NYC, and in 2020 there were 1,521. There were 1,235 and 1,682 motorcycle accidents in NYC in 2018 and 2019, respectively.
Unlike other types of accidents, those involving motorcycles tend to be spread out more evenly across the boroughs, at least in 2021. Brooklyn had the most with 528. Queens (483), the Bronx (293), and Manhattan (329) weren’t far behind. Staten Island had the fewest, with 90 reported motorcycle crashes.
Trucks are involved in between 7% and 8% of all traffic accidents across New York City. In one recent year, there were a total of 16,434 accidents involving semi-trucks, tractor-trailers, and other large commercial vehicles – roughly 7.9%. In another recent year, 8,115 accidents involved large trucks – about 7.3% of the total.
Brooklyn is the site of most of NYC’s truck accidents. In the same recent year discussed above, there were 1,633 truck accidents in the borough. Queens, the Bronx, and Manhattan also had a significant number of collisions involving trucks – 1,948, 1,788, and 1,633, respectively. Staten Island had the fewest, with 202.
According to New York Police Department accident statistics, these were some of the most common causes of motor vehicle collisions in the city in a recent year:
These, of course, are not the only factors that contribute to car accidents in New York City. If you’ve been involved in an accident, it is important to seek legal representation immediately. An attorney will carefully investigate the circumstances of your crash, consult with experts on your behalf, establish fault and liability, and fight to maximize your financial recovery.
Have you suffered traffic-related injuries in NYC or surrounding areas in New York State? If so, contact the Law Offices of Jay S. Knispel Personal Injury Lawyers. Our NYC car accident attorneys can help you understand your rights and seek compensation from those responsible. Your first consultation with our personal injury law firm is free, so call (212) 564-2800 or reach out to us online today.
We have an office in Manhattan at 450 7th Ave #1605, New York, NY 10123, United States. Find us with our GeoCoordinates: 40.693618408700814, -73.9910327551955.
Law Offices of Jay S. Knispel Personal Injury Lawyers
450 7th Ave #1605, New York, NY 10123
(212) 564-2800
(516) 715-5944

New York City Office
450 7th Ave Suite 1605
New York, NY 10123
(212) 564 2800
Brooklyn Office
26 Court St., Suite 2511
Brooklyn, NY 11242
(718) 802-1600
We are available to take your call 24/7